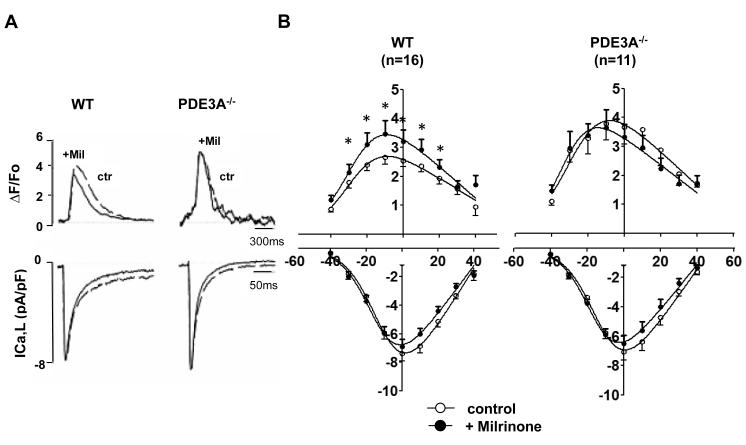
Figure 3. Effects of PDE3A ablation on Ca2+ transients and ICaL.
A) Raw traces of simultaneous Ca2+ transients (top) and ICa,L (bottom) measured at 0mV. The holding potential was −85 mV and a 200 millisecond depolarization ramp to −45mV was added before the depolarization step to 0 mV. The measurements were made 8 minutes after membrane rupture to permit full equilibration of the Fluo-3 dye. Either milrinone (Mil) or vehicle (Ctrl) was added for an additional 8 minutes before measurements of ICaL and Ca2+ transients were made. B) Mean data illustrating effects of PDE3A ablation on Ca2+ transient amplitudes (top) and ICaL densities (bottom) in WT (n=16) and PDE3A−/− (n=9) cardiomyocytes with protocols as in Panel A, except depolarizations were varied from –40mV to +30mV (see Online Methods). *p<0.05 versus control in same group; †p<0.05 between groups.

