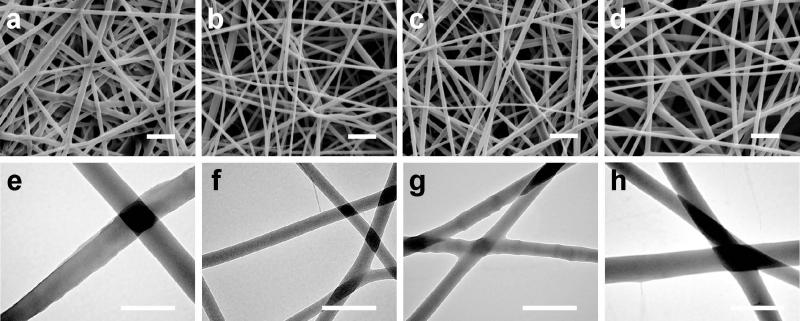
Figure 2.
SEM analysis of S. aureus on nanofibrous membranes at low (top row) and high (bottom row) magnifications. (a, e) PCL only, (b, f) 25% chitosan, (c, g) 50% chitosan and (d, h) 75% chitosan. The samples were fixed after 24 hours of culture with an initial bacteria density of 5 × 10⁴ cells/mL in tryptic soy broth medium. Scale bars represent 5 μm (top row) and 2.5 μm (bottom row). Note the excessive fiber swelling in h.

