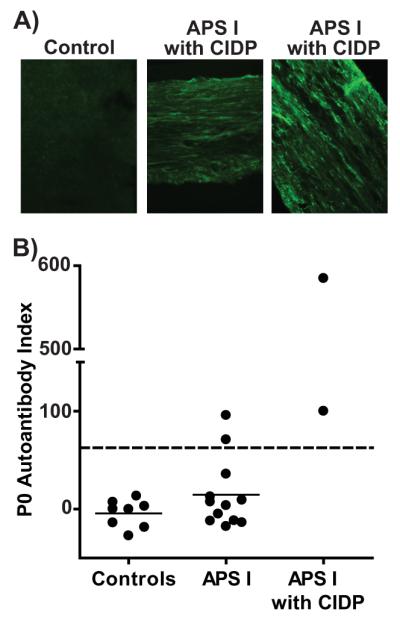
Figure 5. Autoantibodies to P0 in APS1 patients.

A) Indirect immunofluorescence using sera from 2 APS1 patients with CIDP (middle and right) and a healthy control subject (left) against sciatic nerve from an immunodeficient mouse. Images shown are representative of 3 independent experiments. B) Relative titers of P0 reactive autoantibodies in sera from healthy controls (left), APS1 patients without a history of CIDP (middle), and APS1 with a history of CIDP (right) detected by radioligand binding assay. Each symbol represents an individual subject. Dashed line=upper limit of normal, defined as 3 SDs from mean of healthy controls. Solid lines represent means of each group. Representative experiment is shown. Wells were performed in at least duplicate, and at least 6 independent experiments were performed.
