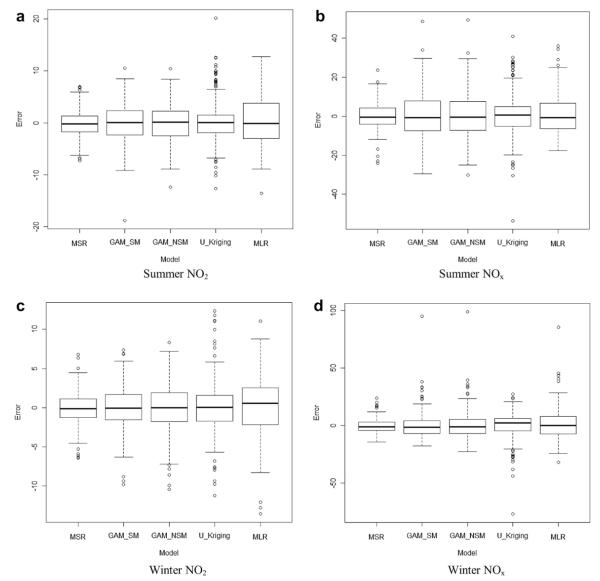
Fig. 1.
Box plots of precision errors for five models of NO2 (a) and NOx (b) in summer and NO2 (c) and NOx (d) in winter (error bars indicate 95% confidence intervals; circles indicate outliers) (MSR: GAM plus cokriging of spatial residuals; GAM_SM: GAM with spatial spline term for coordinates; GAM_NSM: GAM without spatial spline term for coordinates; U_Kriging: universal kriging; MLR: multiple linear LUR).

