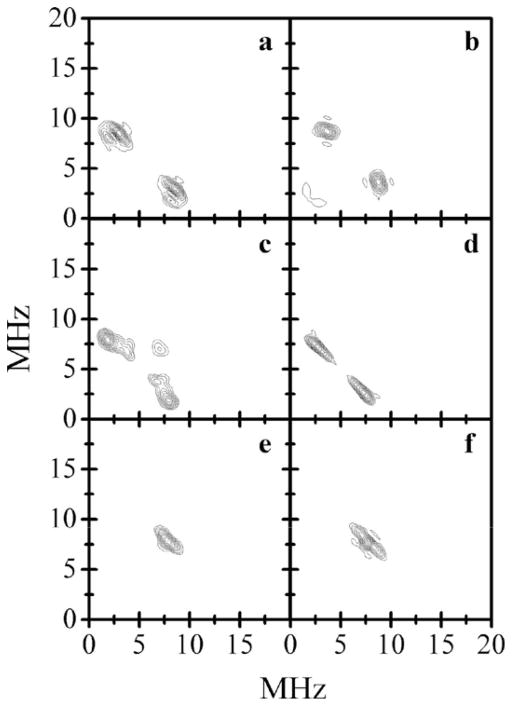
Fig. 10.
Panels a, c, and e, the (++) quadrants of the HYSCORE spectra of 33S-R160Q SO (Species 1) obtained at the gz, gy, and gx EPR turning points, respectively (Bo = 1060.8, 1078.8, and 1088.6 mT, respectively). The spectra shown represent sums of the spectra obtained at time intervals between the first and second mw pulses τ = 170 and 200 ns. Other experimental conditions: νmw = 29.650 GHz; mw pulses, 11, 11, 21, and 11 ns; temperature, 20 K. Panels b, d, and f, simulated HYSCORE spectra for gz, gy, and gx at the EPR turning points, respectively. Simulation parameters: aiso = 2.1 MHz, anisotropic hfi tensor in the principal axes system, (T11, T22, T33 ) = (−4.1, 2.5, 1.6) MHz; e2Qq/h = 36 MHz; η = 0.2; Euler angles for the orientation of the hfi tensor in the g-frame: ϕh = 20°, θh = 10°, Ψh = 20°; Euler angles for the orientation of the nqi tensor with respect to the g-frame: ϕq = 90°, θq = 90°, Ψq = 0°. The simulated spectra (as with the experimental ones) represent sums of the spectra calculated for τ = 170 and 200 ns.
Source: Reprinted with permission from Ref. [25]. Copyright 2008 American Chemical Society.

