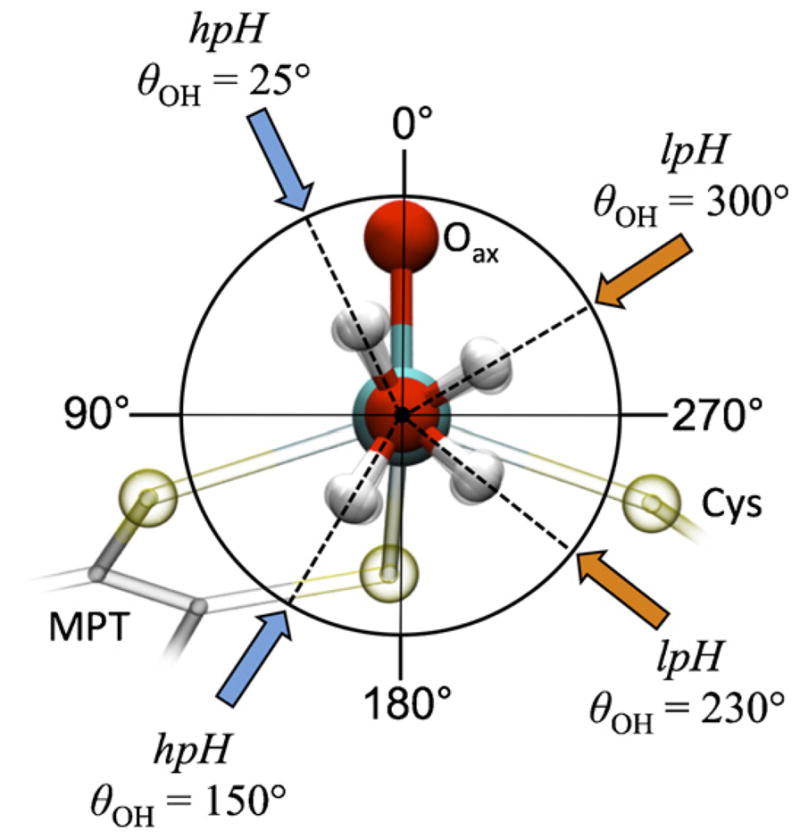
Fig. 6.

Projection along the equatorial Mo O(H) bond of SO, showing the possible orientations of the OH ligand in the hpH (blue arrows) and lpH (orange arrows) forms, as determined by the general agreement of the experimentally measured and DFT-calculated hfi values shown in Fig. 5. θOH is defined in Fig. 5 caption.
