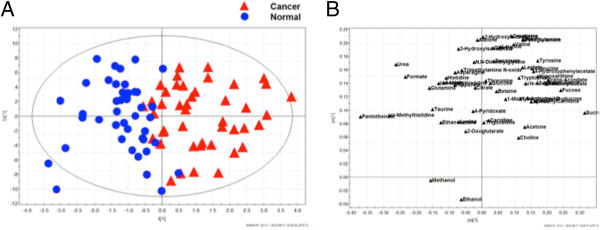
Figure 1.

OPLS-DA score plot of metabolite profiles derived from esophageal carcinoma and healthy controls with corresponding loading plot.A) Supervised OPLS-DA score plot. Two-component model based on 53 measured urinary metabolites. Esophageal cancers are represented by red triangles and blue circles depict controls. B) OPLS-DA loading plot of urinary metabolite profiles derived from esophageal carcinoma and healthy controls. OPLS-DA, orthogonal partial least squares discriminant analysis.
