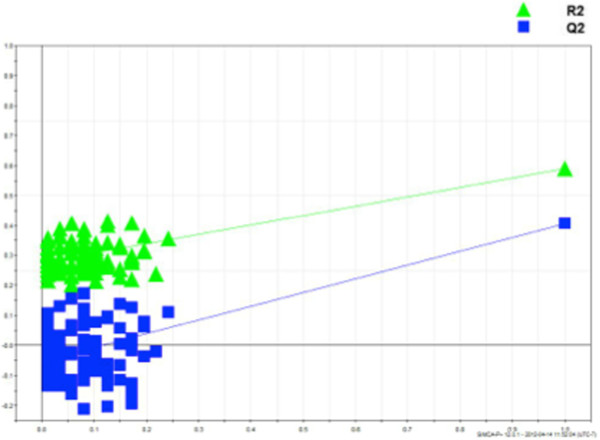
Figure 5.
Permutation analysis of OPLS-DA model derived from esophageal carcinoma versus healthy controls. Statistical validation of the OPLS-DA model by permutation analysis using 100 different model permutations. The goodness of fit (R2) and predictive capability (Q2) of the original model are indicated on the far right and remain higher than those of the 100 permuted models to the left. OPLS-DA, orthogonal partial least squares discriminant analysis.

