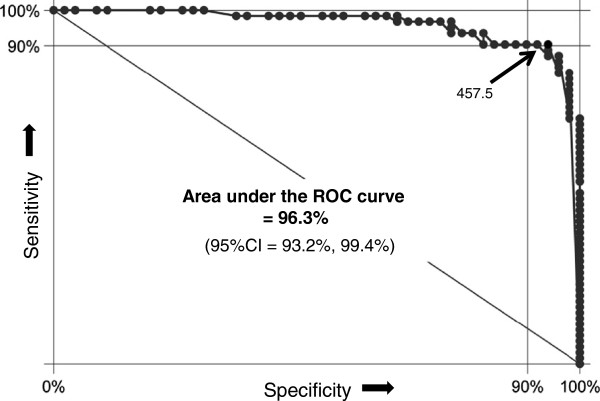
Figure 5.
ROC-curve of the best pain-drawing criteria group. This receiver operating characteristic (ROC) curve illustrates the sensitivity and specificity of the combination of pain-drawing criteria with the highest diagnostic accuracy (total number of marks, length of the longest mark, and presence of symmetric pain zones). Virtually each possible cut-point is plotted against specificity (x axis) and sensitivity (y axis). The cut-off of 457.5 generated 93.9% specificity and 90.3% sensitivity, which represents the mathematical optimum of correctly diagnosed cases

