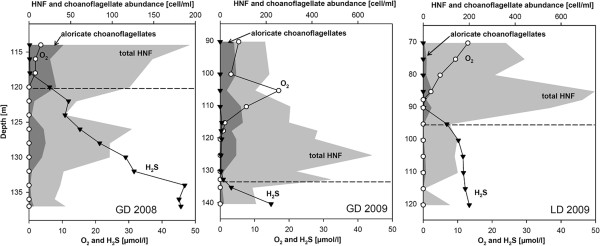
Figure 2.

Abundance of heterotrophic nanoflagellates (light grey) and relative abundance of naked choanoflagellates (dark grey) in redoxclines of Gotland Deep in 2008 (GD 2008) and 2009 (GD 2009) and Landsort Deep 2009 (LD 2009) based on epifluorescence microscopy. The horizontal dashed line represents the first appearance of hydrogen sulfide (chemocline). Note the changes in the scale of some axis between the two years.
