Figure 1.

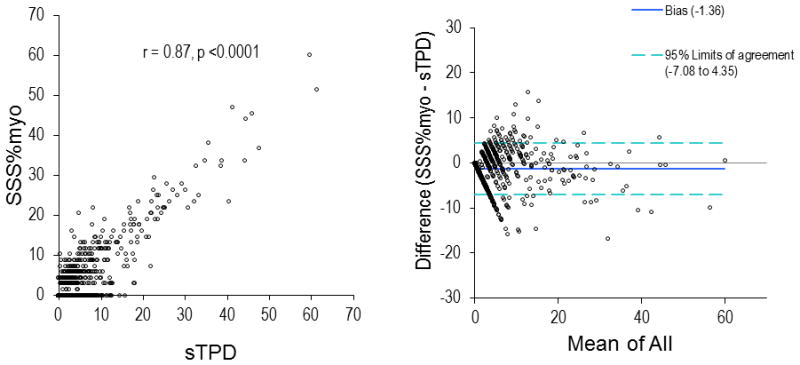
Correlation and Bland-Altman plot between sTPD and SSS%myo. sTPD, stress total perfusion deficit; SSS%myo, summed stress scores as a percentage of abnormal myocardium.

Correlation and Bland-Altman plot between sTPD and SSS%myo. sTPD, stress total perfusion deficit; SSS%myo, summed stress scores as a percentage of abnormal myocardium.