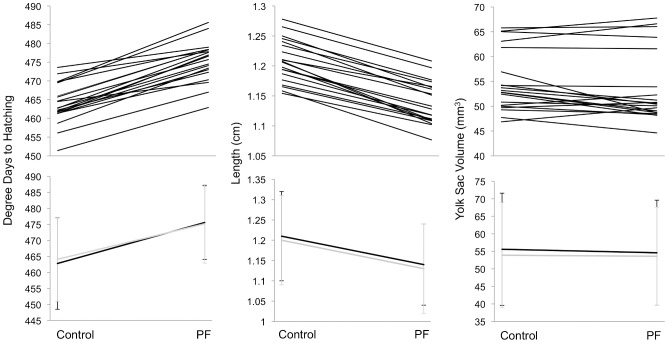
Figure 5. Reaction norm plots of hatching time, larvae length, and yolk sac volume.
In the upper panel, each line corresponds to sire (N = 20) means across all females. Lines in the lower panel represent means (±SD) per within-population (black) or between-population cross (light grey). PF: P. fluorescens.

