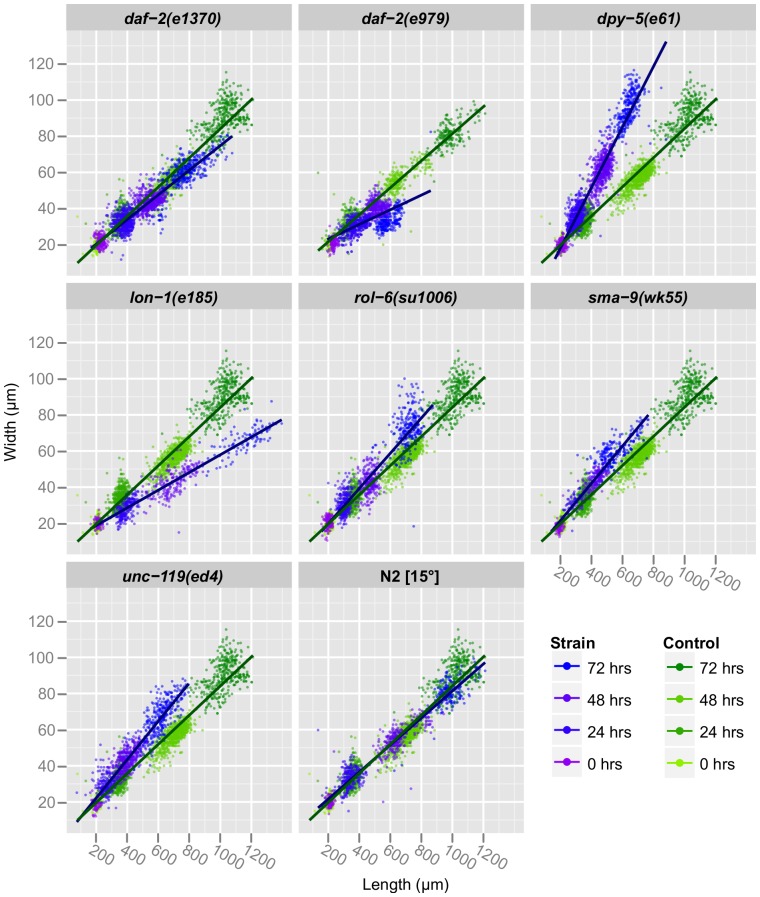
Figure 7. Analyzing length and width over time approximates nematode morphology.
Length and middle width of individual animals is plotted for each strain and its control, with time points indicated by color. A linear regression is included for each strain, and the slope of this regression provides an indication of shape.

