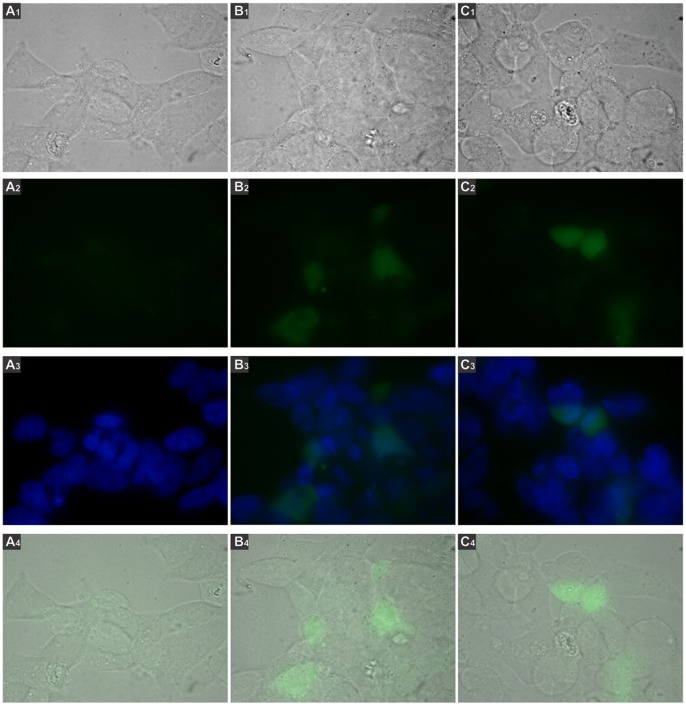
Figure 3. GFP activity driven by the pr1 or pr7 regions.
293 T cells were transfected with plasmids pr1-eGFP, pr7-eGFP or Δpr-eGFP, incubated for 48 h and analyzed by fluorescence microscopy using the Nikon Eclipse TE2000 microscope equipped with a CCD camera, with 1000X magnification. Green fluorescence photos were taken with 400 ms of exposure and 3.2 of gain. Numbers 1, 2, 3, 4 correspond to images visualized with white light, green filter, merge between DAPI and green filter and merge between white light and green filter, respectively. A. Cells transfected with the Δpr-eGFP plasmid. B. Cells transfected with pr1-eGFP. C. Cells transfected with pr7-eGFP.

