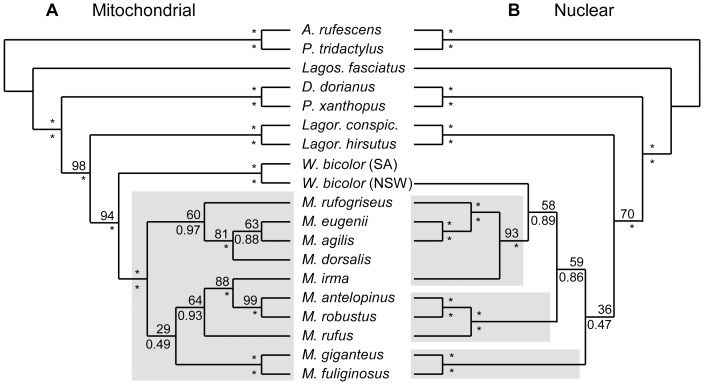
Figure 2. Phylogenetic analysis of kangaroos and wallabies.
Maximum likelihood phylogenies inferred from the (A) mitochondrial (Mt16) and (B) nuclear (Nuc17) concatenated datasets, with RAxML bootstrap values (BPML) above branches and MrBayes Bayesian posterior probabilities (BPP) below branches. The mt placement of M. dorsalis is derived from the reduced-length Mt17 and the mt placements of M. antilopinus and W. bicolor (NSW, New South Wales) are derived from the Cytb 18 alignment. Support for grouping M. eugenii and M. agilis increases (BPML = 88; BPP = 0.98) for Mt16, which excludes M. dorsalis, but increases sequence length. Asterisks indicate full support. Clades including members of Macropus are shaded.

