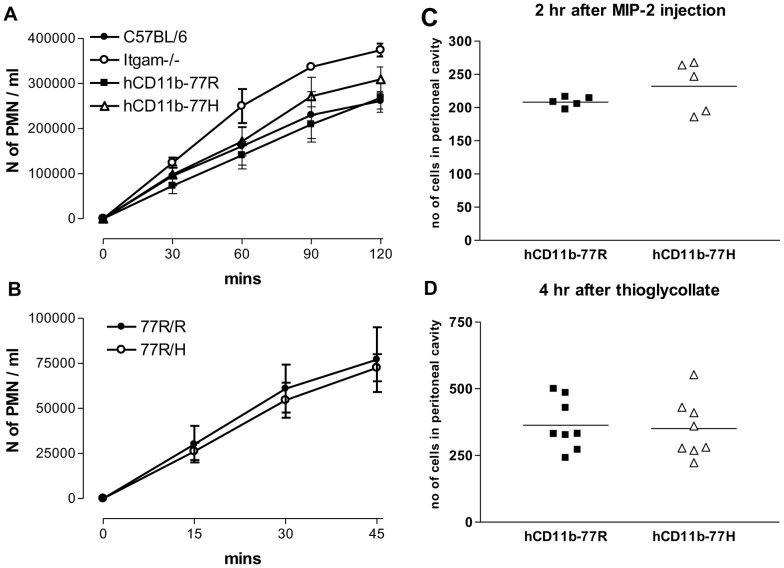
Figure 4. In vitro and in vivo PMN migration.
(A) Migration of neutrophil cell lines through transwells seeded with mouse endothelial cells. PMNs migrated into the bottom chamber in response to MIP-2 were counted at different time points as indicated. Pooled results from at least 4 independent experiments are presented as mean ± SEM. Itgam−/− and wild type C57BL/6 neutrophil cell lines were used as controls. CD11b-deficient PMNs, known to have weaker endothelial interactions, migrated faster than the C57BL/6 and the hCD11b expressing cell lines (p<0.001 at 60 mns and p<0.05 at 90 mns). Statistical analysis by Bonferroni's multiple comparison test. (B) Time course of the migration of freshly isolated human 77R/R or 77R/H neutrophils through a HUVEC layer in response to MIP-2. Pooled results from at least 4 independent experiments are presented as mean ± SEM. (C, D) In vivo peritoneal migration of hCD11b-77R and hCD11b-77H PMN cells lines following i.p. injection of MIP-2 (C) and thioglycollate (D). The two hCD11b expressing PMN lines were labelled with DDAO or CFSE and adoptive transferred at a 1∶1 ratio into C57BL/6 mice. Absolute numbers of labelled PMNs recovered from the peritoneum are shown. Data of one out of at least 3 independent experiments are presented. Bars indicate means.

