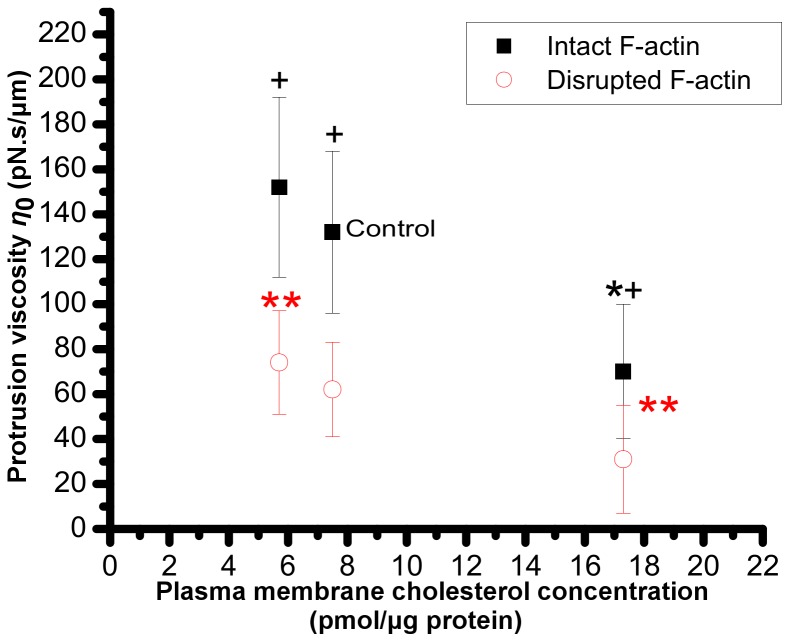
Figure 8. Protrusion viscosity.
Effect of membrane cholesterol content on the viscosity coefficient of the protrusion for cells with intact or disrupted F-actin. Asterisk (*) indicates a statistically significant difference with control; ** indicates a statistically significant difference between the two indicated data sets; and + indicates a statistically significant difference between intact F-actin and F-actin disrupted cells at the same cholesterol concentration.

