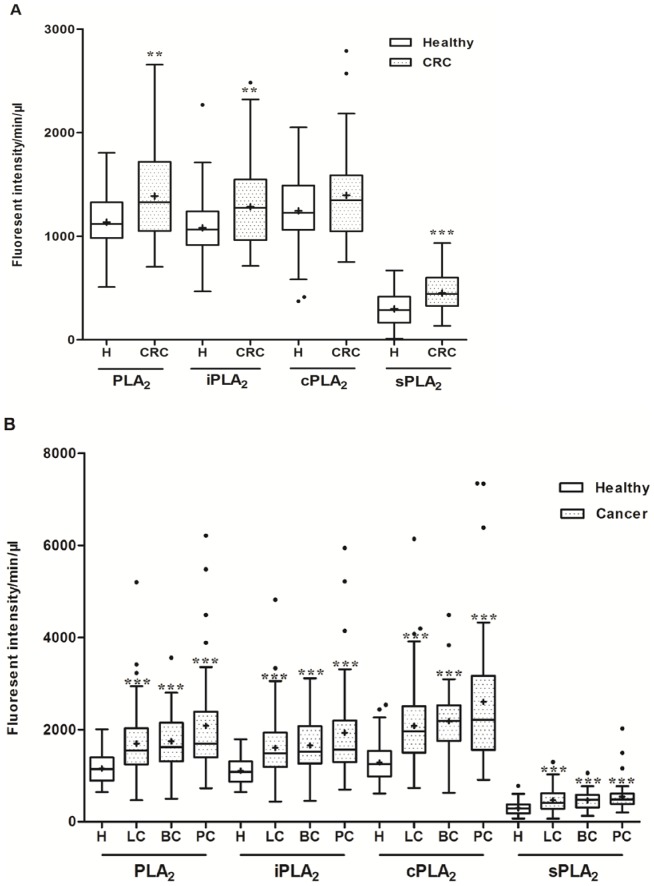
Figure 1. Plasma PLA2 activities were elevated in cancer groups vs. healthy controls.
Comparison of PLA2 activities in the healthy control (normal colonoscopy; n = 77) and CRC (n = 38) groups. A. Comparison of PLA2 activities in the healthy (n = 79) and other cancer groups. Lung cancer (LC, n = 95), bladder cancer (BC, n = 31) and pancreatic cancer (PC, n = 38). The distribution of the natural and individual groups of PLA2 activities were analyzed as described in Materials and Methods. The mean values of PLA2 activities were presented by the “+” in the figure. * P<0.05; ** P<0.01; *** P<0.001.

