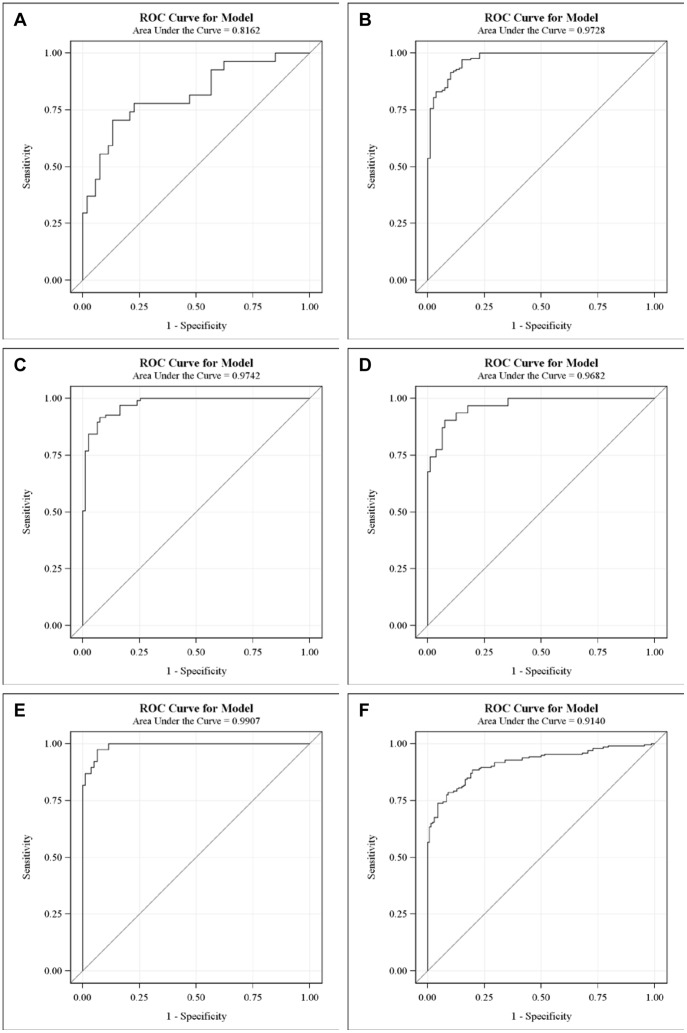
Figure 9. ROC curves of plasma PLA2 activities with additional parameters.
CRC cases vs. healthy subjects. A. All cancer cases vs. healthy subjects in the second set. B. Lung cancer vs. healthy subjects. C. Bladder cancer vs. healthy subjects. D. Pancreatic cancer vs. healthy subjects. E. All cancers vs. all healthy subjects with combined two sets.

