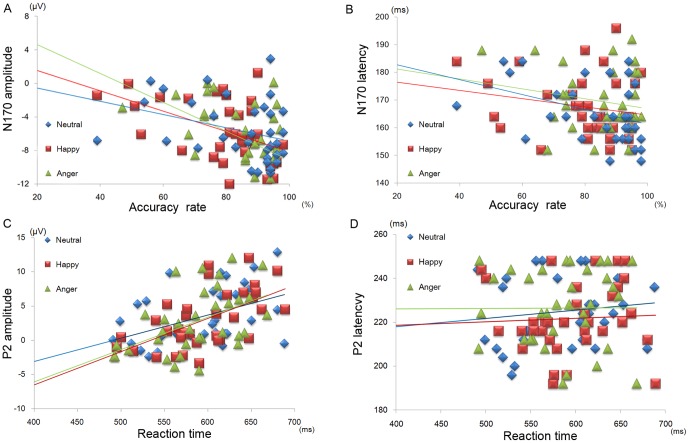
Figure 5. Scatter plot of the behavioral and ERP data.
(A) Relationship between accuracy rate and N170 components: N170 amplitudes for angry and happy faces, and N170 latencies for neutral faces. (B) Relationship between reaction times and P2 components. Each plot indicates each participant, and each line depicts a regression line for a facial expression.

