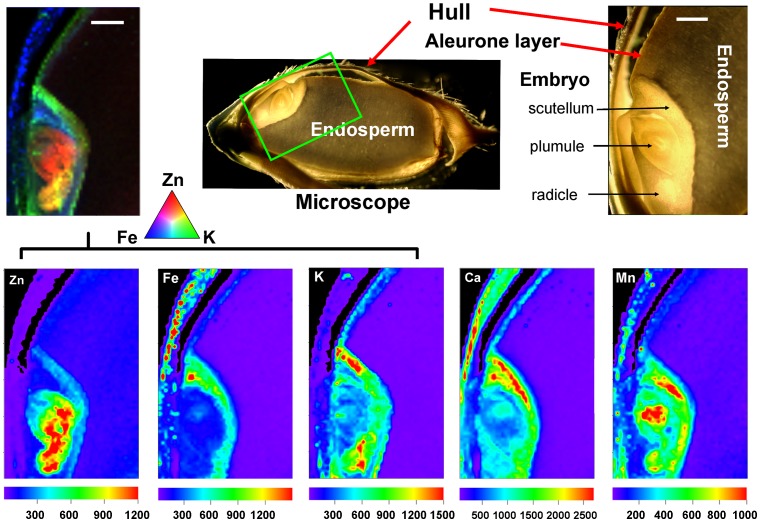
Figure 4. µ-XRF elemental maps for Zn, Fe, K, Ca, and Mn in rice grains.
The green rectangle in the primary microscope image (top, center) has been rotated ca 75° counterclockwise to give the enlarged, labeled image (top right). This also is the orientation of the individual element distribution maps (lower row) and the color merged image (upper row, left). The fluorescence yield counts were normalized by I0 and the dwell time and maximum values vary for each element (scales beneath each false color map). Pixel brightness is displayed in RGB, with the brightest spots corresponding to the highest element fluorescence. The color-merged image shows the relative locations of Zn (red), K (green), and Fe (blue), as indicated by the colored triangle scale.

