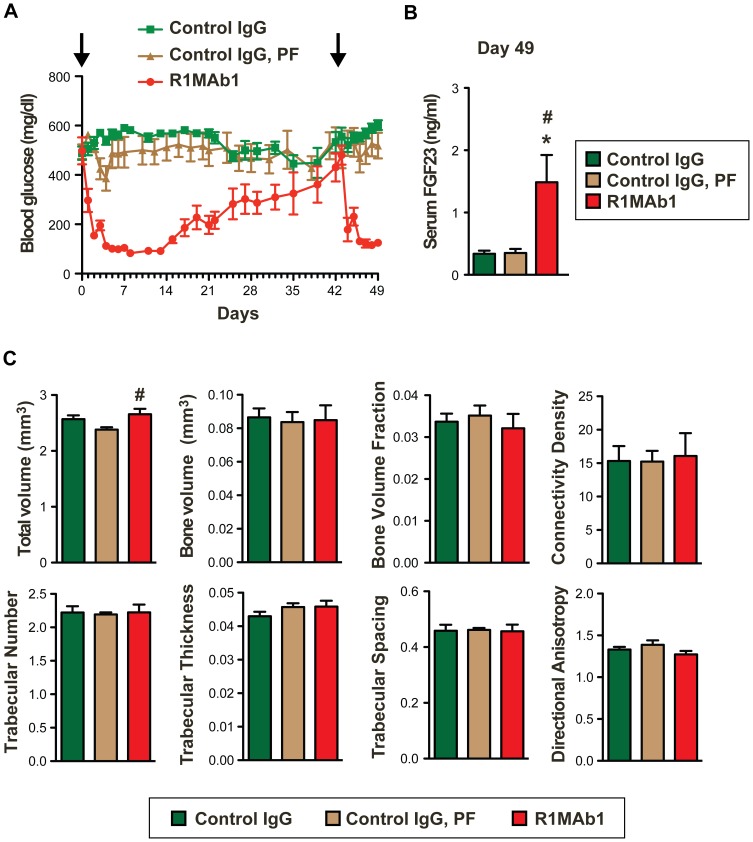
Figure 5. Bone effects of R1MAb2 treatment.
(A) Blood glucose levels of female db/db mice (N = 8 mice/group) during the study. The mice received intraperitoneal injection of R1MAb1 or control IgG at 3 mg/kg doses on day 0 and day 42 (Arrow). Statistical significance in glucose reduction (p<0.05) was observed between day 3–31 and day 43–49. (B) Serum FGF23 levels of mice in (A) on day 49. p<0.01, N = 7–8 mice/group. (*# p<0.05, versus Control IgG (*) or versus Control IgG, PF (#)) (C) Bone phenotype of mice described in (A–B). The bones were dissected on day 49, and subjected to μCT analysis. Statistical significance (p<0.05) was observed only for total volume, but not other parameters shown. # p<0.05 (versus Control IgG, PF).

