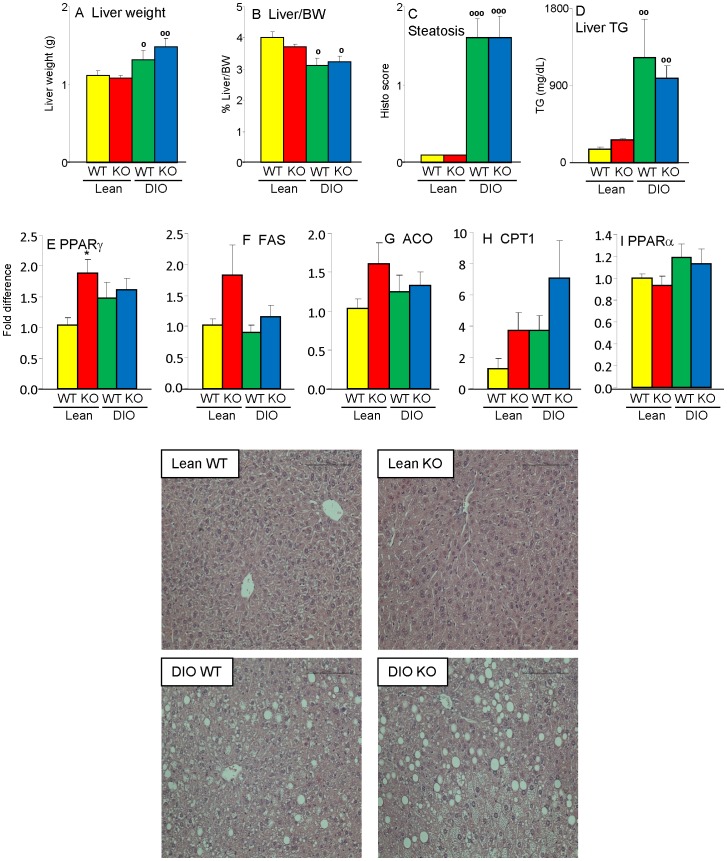
Figure 2. Hepatic steatosis in DIO WT and Gal-3 KO mice.
Liver weight (A), ratio of liver/body weight (B), degree of hepatic steatosis (C), liver TG levels (D) as well mRNA expression of PPARγ (E), FAS (F), ACO (G), CPT1 (H) and PPARα (I) were evaluated in Lean WT (yellow), Lean Gal-3 KO (red), DIO WT (green) and DIO Gal-3 KO (blue) mice. Gene expression data are presented as fold difference versus Lean WT mice after normalization for expression of GAPDH. A representative H&E staining (20X) from each group is shown. Data are mean+/−SEM, n = 10. *p<0.05 versus respective WT group; °p<0.05, °°p<0.01, °°°p<0.001 versus respective Lean group.

