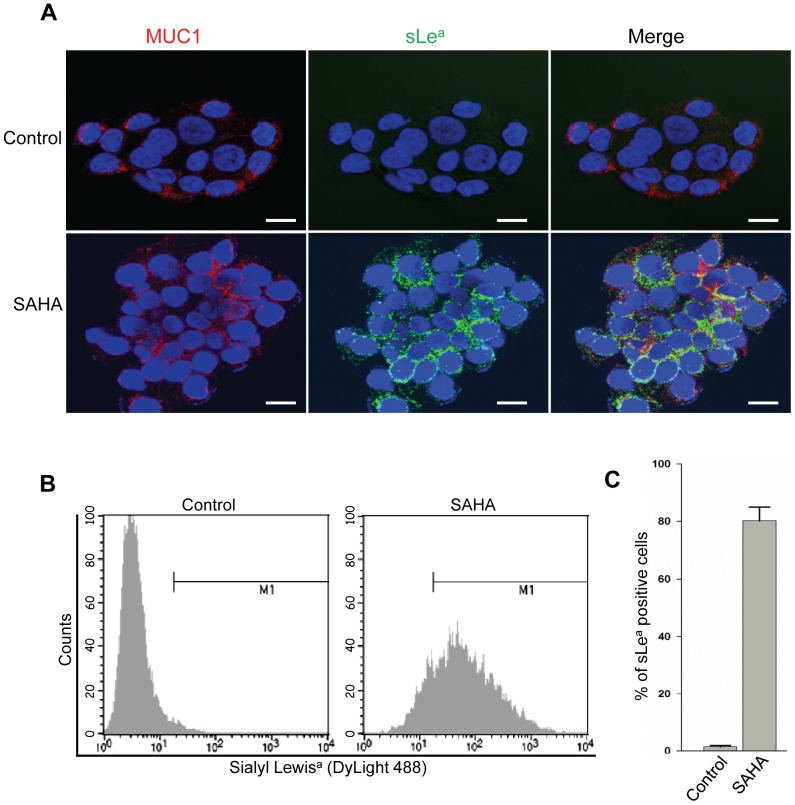
Figure 4. Confocal and flow cytometric analysis of RWPE-1 cells.
(A) Confocal immunofluorescence images of MUC1 (red) and sLea (green) on RWPE-1 cells treated with PBS (control) or SAHA (5 µM) for 72 h. SLea induced by SAHA is colocalized with MUC1. (B) SLea mean fluorescence intensity in RWPE-1 cells treated with PBS or SAHA as measured by flow cytometry analysis. (p < 0.05) (C) % of sLea-positive cells in PBS- or SAHA-treated cells. The data expressed as mean ± SEM were obtained from three independent experiments. (p < 0.05) Bar = 20 µm.

