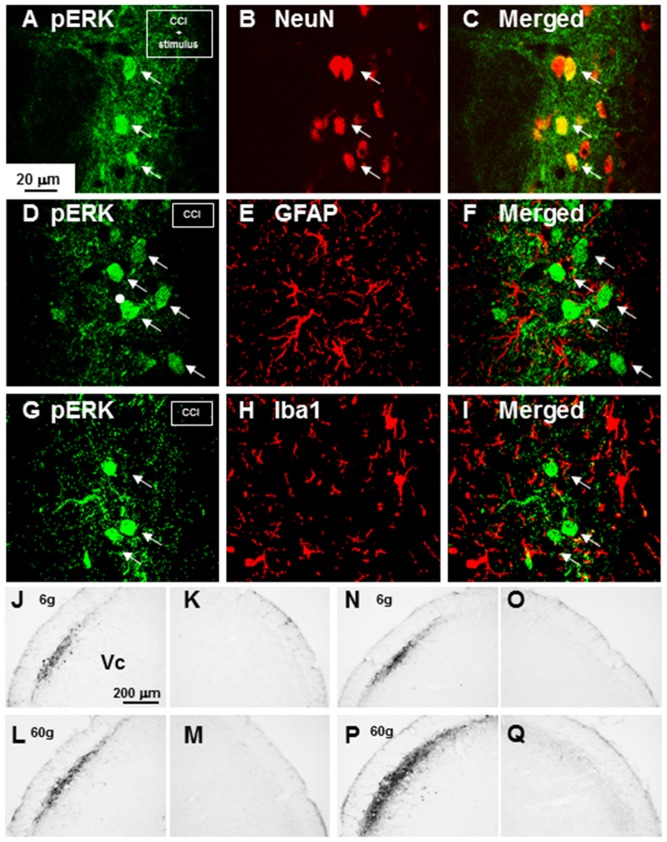
Figure 2. Photomicrographs of pERK-IR, NeuN-IR, GFAP-IR and Iba1-IR cells in Vc.
A–C: Fluorescent photomicrographs of pERK-IR cells (A), NeuN-IR cells (B) and merged photomicrograph of A and B (C) ION-CCI rats. D–F: Fluorescent photomicrographs of pERK-IR cells (D), GFAP-IR cells (E) and merged photomicrograph of D and E (F) in ION-CCI rats. G–I: Fluorescent photomicrographs of pERK-IR cells (G), Iba1-IR cells (H) and merged photomicrograph of G and H (I) in ION-CCI rats. J–M: pERK-IR cells following 6 g stimulation of the whisker pad skin on the side ipsilateral to the sham operation (J), those in the contralateral side (K), those following 60 g stimulation on the ipsilateral side (L) and those in the contralateral side (M), N–Q: pERK-IR cells following 6 g stimulation of the whisker pad skin on the side ipsilateral to the ION-CCI (N), those in the contralateral side (O), those following 60 g stimulation in the ipsilateral side (P) and those in the contralateral side (Q).

