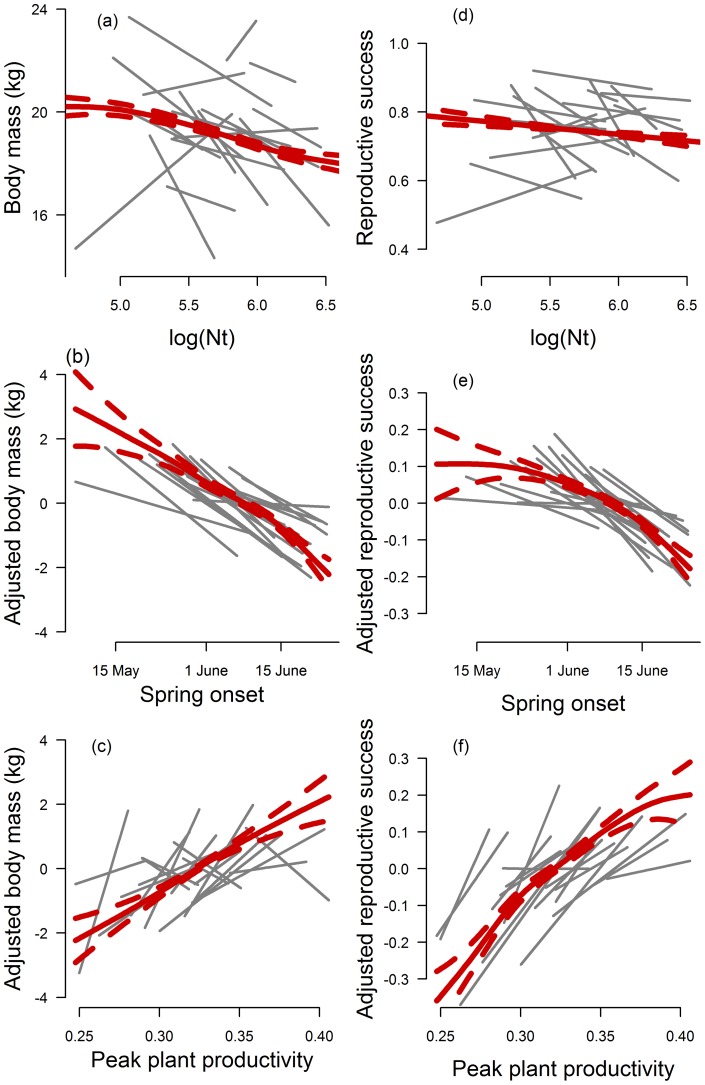
Figure 2. Left panel .
: (a) The effect of number of females (log[Nt]), (b) onset of spring, and (c) peak plant productivity on body mass of calves slaughtered in the autumn. Right panel: (d) The effect of number of females (log[Nt]), (e) onset of spring and (f) peak plant productivity on reproductive success. Red solid lines give estimated mean and standard error (red dashed lines) using generalized additive mixed modelling. Grey lines are estimated relationships for individual populations based on linear regressions.

