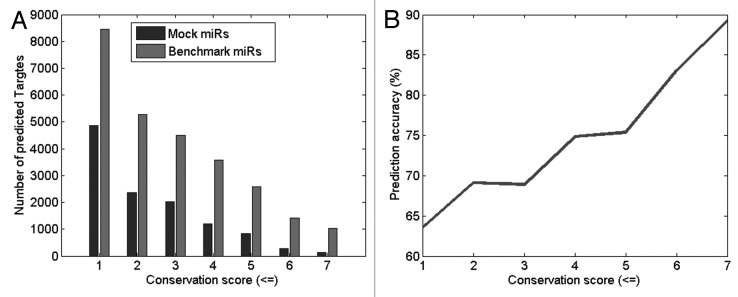
Figure 1. Predicted miRNA targets for all human 3′UTRs when using 5 benchmark miRNAs and 5 Mock miRNAs across different conservation scores for the predicted binding site. (B) Bar chart shows that the number of predictions is significantly higher for the 5 benchmark miRNAs (grey bars) in comparison to the 5 mock miRNAs (black bars). (B) The prediction accuracy (gray line) is shown to increase as the conservation score increases.
