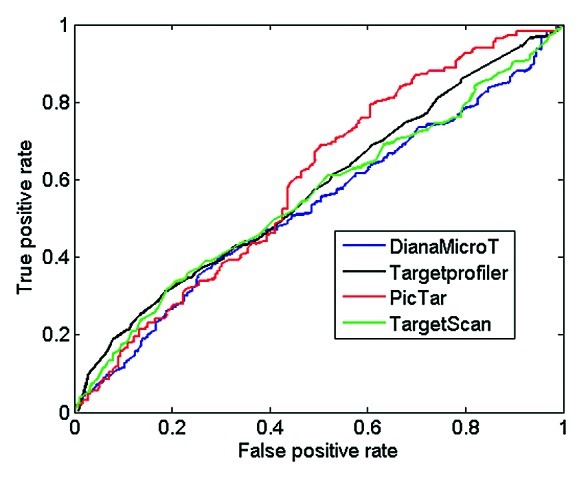
Figure 2. ROC curves using proteomics data from pSILAC. All target sites predicted by Targetprofiler, DianaMicroT, TargetScan and PicTar (conserved and non-conserved) displaying a log2 fold change cut-off of < -0.1 according to the pSILAC mass spectrometry data were used as true positives. The predictions were sorted by classification scores for each individual tool and the sensitivity and specificity were calculated as described in Materials and Methods in order to calculate the true positive (sensitivity) and false positive rate (1-specficity) for different prediction thresholds of all the tools analyzed.
