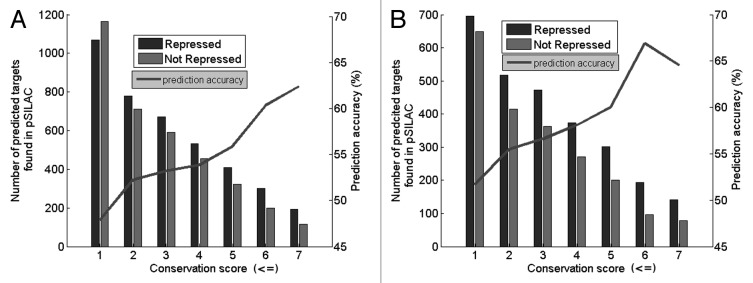
Figure 3. Bar chart of prediction results using the 5 benchmark miRNAs and data form pSILAC. Black bars represent predictions by Targetprofiler found in the Refseq database and shown to be repressed by a log2 fold change cut-off of -0.1. Gray bars are those predictions which exceed the fold change cut-off and hence are considered as non-repressed. Prediction accuracy (gray line) is shown across various conservation scores. (A) Represents data prior to filtering, (B) represents data after filtering. The optimum results (prediction accuracy 66.9%) is obtained when the data are filtered, for a conservation score of 6 and an HMM score of 3.
