
Figure 3.
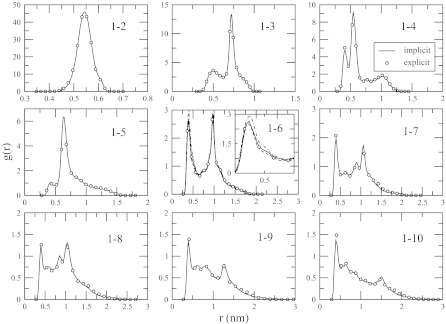
Pair distribution functions for different contacts as indicated in the graph, obtained in the explicit and implicit solvent simulations at T = 300 K. The two data sets are hardly distinguishable. An agreement of the same high quality is observed for the distribution functions involving the ACE methyl group. To illustrate the degree of convergence in the explicit solvent simulations, the panel for contact 1–6 shows the data for the first, broken line, and the last, dotted/broken line, 60 ns of the trajectory. Differences between the two parts are noticeable only upon magnification, as shown in the inset for the first maximum.