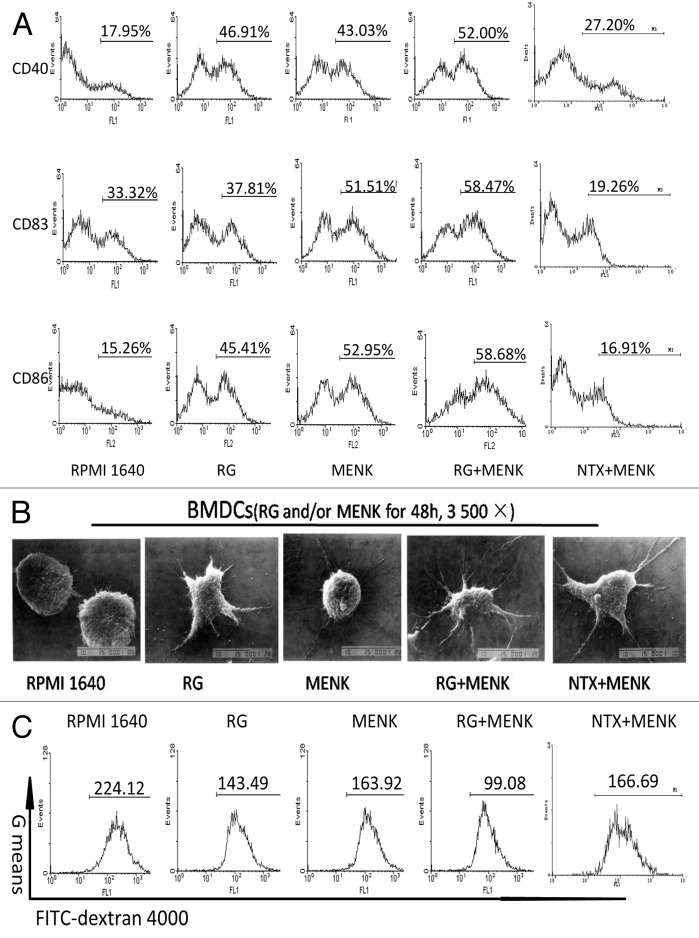
Figure 2. Up-regulation of key surface molecules on BMDCs after treatment with RG and/or MENK for 48h. (A) The cells were respectively collected and stained with mAbs to CD40, CD83, and CD86. Expression of surface markers was analyzed by FCM and was displayed respectively by the single parameter diagram. The values shown in the profiles were the gated %. Results represent the mean ±SD of three independent samples. The images of BMDCs before and after treatment with RG and or MENK (B) by SEM (B) (×3500).

An official website of the United States government
Here's how you know
Official websites use .gov
A
.gov website belongs to an official
government organization in the United States.
Secure .gov websites use HTTPS
A lock (
) or https:// means you've safely
connected to the .gov website. Share sensitive
information only on official, secure websites.
