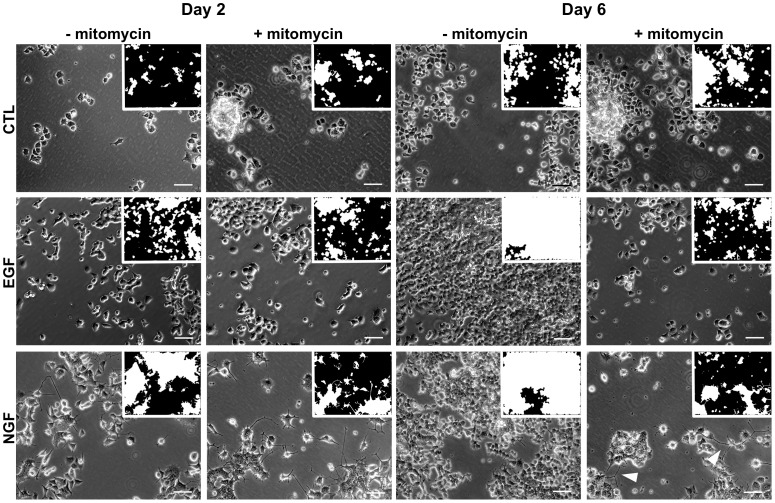
Figure 1. Phase contrast images of live-cells under the monitored conditions for days  and
and  after treatment.
The images have been selected using the FDA classifier that has its median FDA score on training day  . For clearer examples of the differentiated state, we selected for the NGF without mitomycin treatment images which correspond to the
  % quantile instead of the
  % median. Small inserts show the resulting ROI for each image. The white arrows indicate outgrown neurites on day
  . The proliferative effect of both EGF and NGF treatment without mitomycin is evident from the increased ROI on day
  . Mitomycin treatment inhibits proliferation and enhances the visibility of neurites. Bar,
  m.
m.

