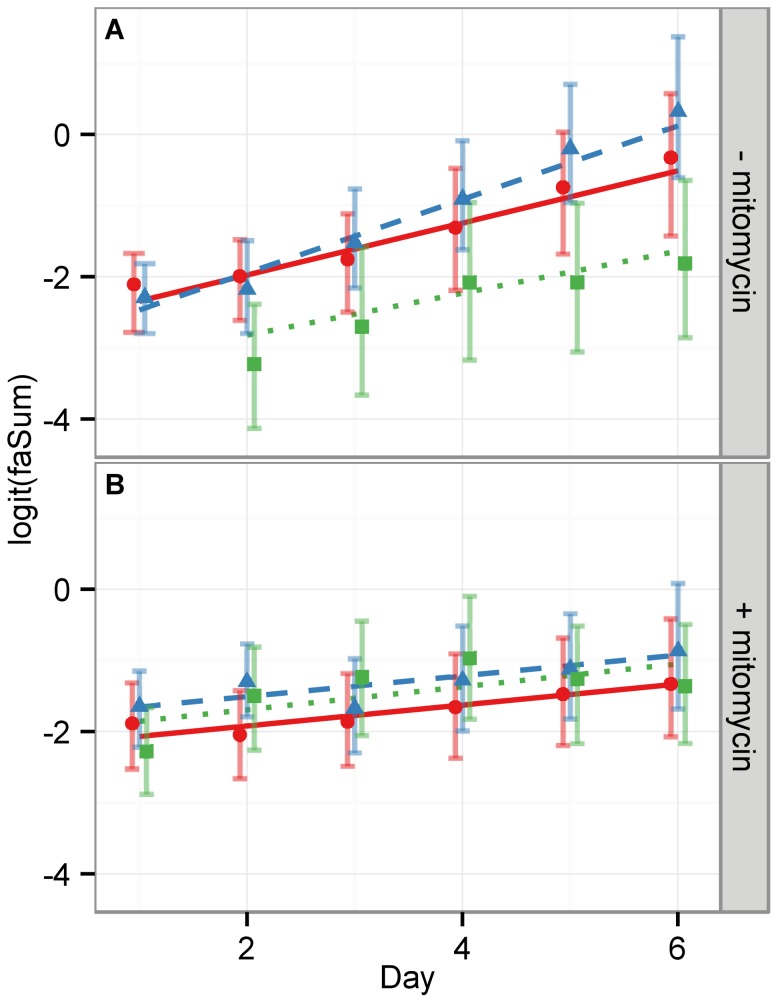
Figure 2. The image feature faSum measures qualitatively the cell area fraction occupying the well.
As an approximation to cell content in a well, we show here the faSum feature. It corresponds to the white ROI area as shown in Figure 1. Since cells can vary in size this is only a qualitative measure of cell numbers. The upper panel (A) shows each condition without mitomycin treatment, whereas the lower panel (B) depicts the respective well with mitomycin treatment. Red circles and solid lines indicate the medians of the measurements of CTL cells, green squares and dotted lines of NGF stimulated cells and blue triangles and dashed lines of EGF stimulated cells. The error bars mark the  % c.i. and the lines depict linear regression analyses with slopes listed in Table 3. While the slopes of the regression lines in (B) with mitomycin are all statistically equivalent, the slope of the EGF treated cells in (A) is significantly larger then the respective NGF and CTL cells. This well reflects the biological known circumstance that EGF promotes proliferation.

