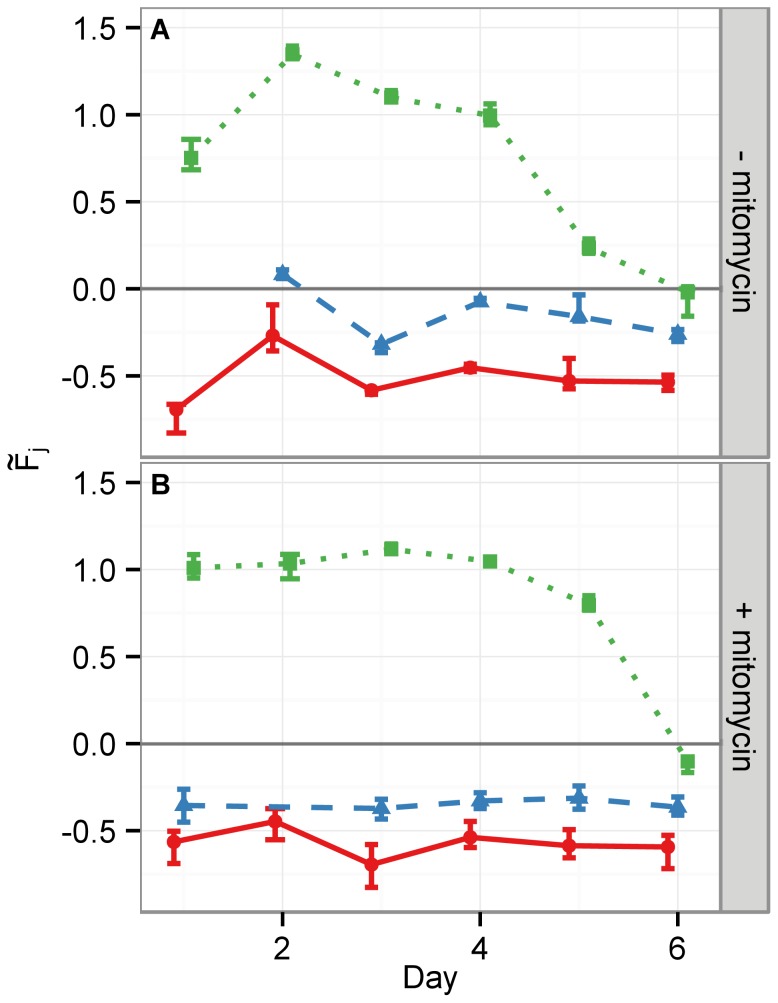
Figure 3. Median responses of the five independent FDA classifiers using the hold-out data set.
The error bars depict the  % c.i. Panels (A) and (B) show the FDA classifier response (
 ) to cells without or with mitomycin treatment, respectively. The lines are shown to guide the eye and depict the measurement medians for the different treatment conditions. CTL: red circles and solid lines, NGF: green squares and dotted lines, EGF: blue triangles and dashed lines. The horizontal line through the origin
  marks the decision threshold. FDA scores larger than
  correspond to the differentiated cell status while scores below correspond to undifferentiated cells. Only on day
  EGF treated without mitomycin in panel (A) are slightly above
  , such that approximately
  % of the cells under this condition are falsely classified as differentiated. However, NGF treated cells are always far away from the decision threshold
  within the first four days. Hence, a more conservative threshold would remedy the false decision for EGF on day
  while still correctly classifying NGF treated cells.

