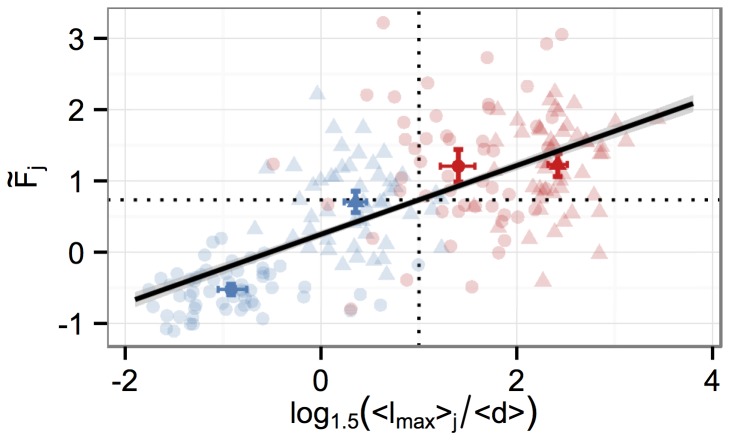
Figure 6. Correspondence of classifier score and biological differentiation criterion.
Per cell we measured the longest neurites  and diameters
  on day
  (blue) and
  (red) without (circles) and with mitomycin (triangles) of cells receiving NGF stimulation. Transparent points represent individual cell and neurite length measurements per image and bold symbols depict the respective mean values (with
  % c.i.) of the classifier score (
 ) of image
  and the quantity
  on the given day. If this value is larger than
  , marked by the vertical dotted line, the length of the longest neurite of a cell is at least
  times the cell diameter. This is a commonly used biological threshold criterion for differentiation. The correlation with the respective FDA scores is
  and the fitted linear regression line (black line,
  % c.i. shown in grey) has a positive slope of
  . Therefore, the neurite length to cell diameter ratio is proportional to the classifier score. The threshold of
  of the biological criterion corresponds to a threshold of
  of the classifier on average (horizontal dotted line), i.e. choosing this threshold for the FDA will result in a decision of the FDA which is (on average) equivalent to the biological definition.

