
Figure 1.
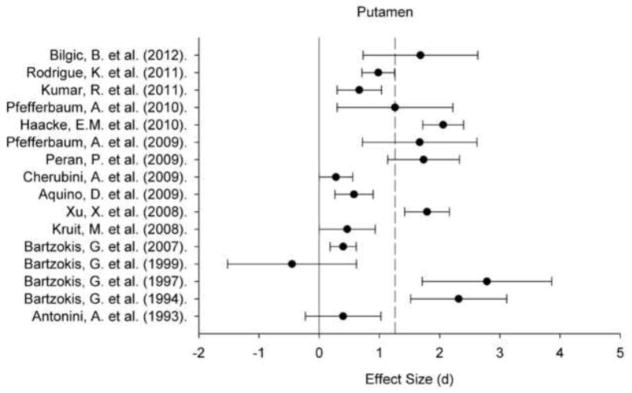
A plot of effect sizes for age differences in iron content of the putament (Pt). Sample size-corrected effect sizes (d) are shown with 95% confidence intervals and the median value across studies is marked with the dotted line. Confidence intervals not including zero indicates significant age-related difference.