
Figure 4.
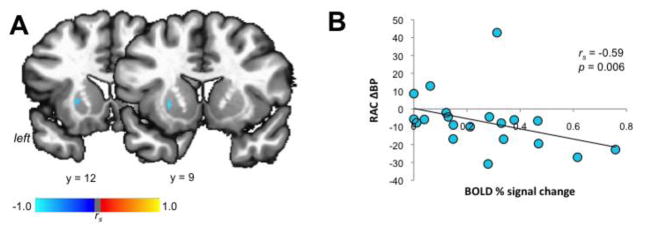
The left APU shows coupling between dopamine release and brain activation. Relationship between speech-induced RAC ΔBP and BOLD percent signal change during speaking is shown on a series of coronal images (A) and on a bar graph and correlation plot (B). The color bars depict Spearman’s correlation coefficients (rs). APU – anterior putamen; RAC BP – binding potential of the [11C]raclopride radiotracer.