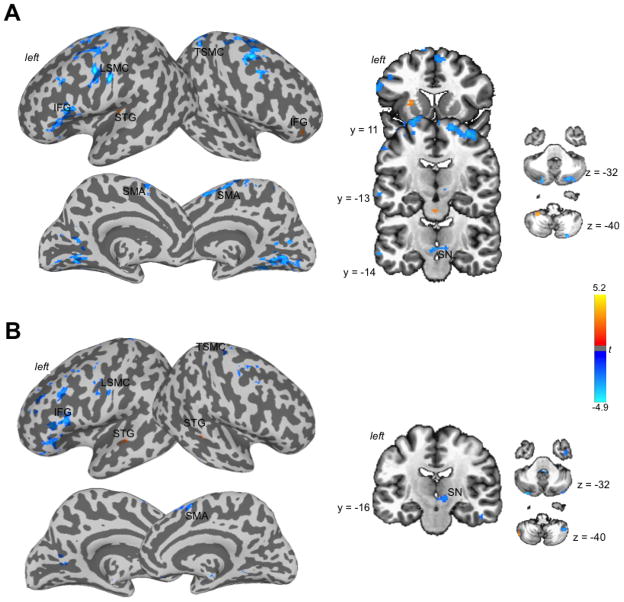
Figure 5.
Functional networks of the left (A) and right (B) APU during speech production. Cortical connections using the APU as a seed are shown on the inflated brain surfaces in the standard Talairach space; subcortical and cerebellar connections are shown on a series of coronal and axial images. The color bar represents the t statistics of the network. APU – anterior putamen.

