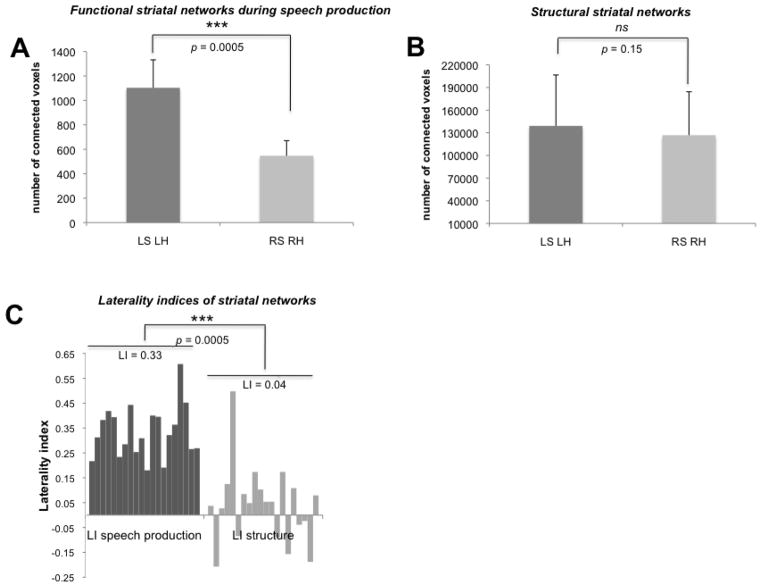
Figure 7.
Bar graphs show lateralization effects of APU functional connectivity during speech production (A) and structural connectivity (B) as well as the corresponding laterality indices (C). Each bar in (C) corresponds to a single subject. (*) indicates the statistical significance of the comparison; ns non-significant comparison; LS – left seed, RS – right seed, LH – left hemisphere; RH – right hemisphere; LI – laterality index; APU – anterior putamen.

