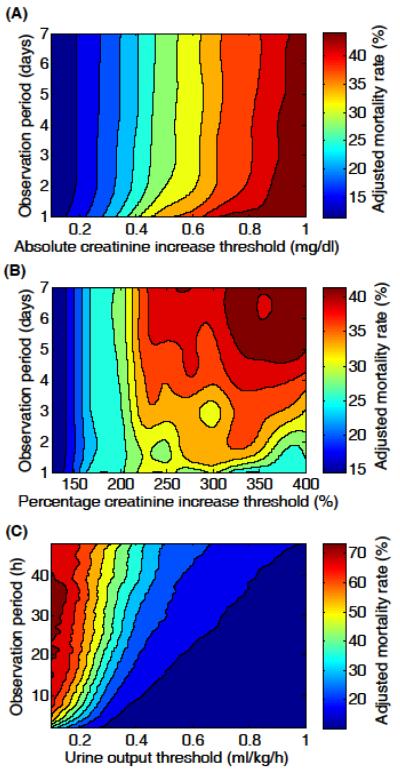
Figure 1.
Adjusted in-hospital mortality rate contour plots for (A) absolute increase in serum creatinine (N=17,227), (B) percentage increase in serum creatinine (N=17,227), and (C) urine output (N=14,526). Adjusted mortalities were evaluated at a fine grid of observation periods and thresholds (steps of 1 day, 1 hour, 0.1 mg/dl, 25% points, and 0.1ml/kg/h), and the contour plots were produced using cubic spline interpolation.

