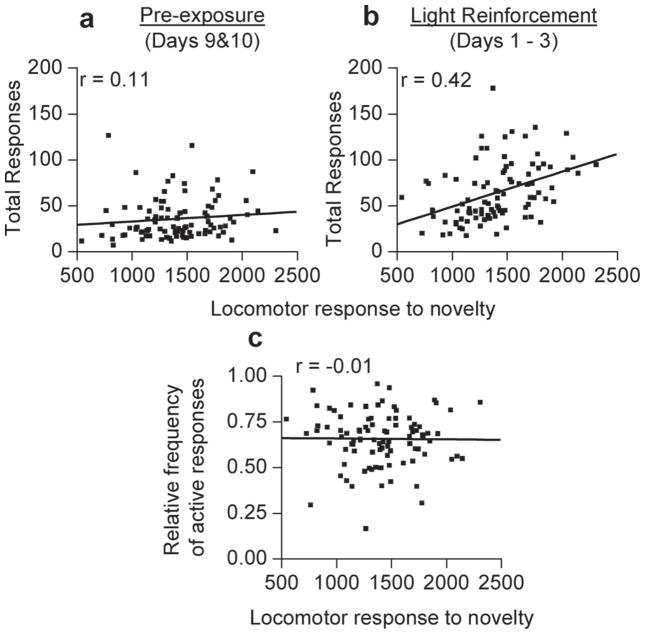
Fig. 2.
Scatterplots showing associations between Loco and total responses of pre-exposure and VSR testing in all animals (n = 93). (a and b) Locomotor scores are represented on the X-axis, and total responding during pre-exposure or VSR is represented on the Y-axis. (a) A scatterplot of locomotor movements in 1 h exposure to novel environment and total responses made during last 2 days of pre-exposure testing (i.e., dark chamber with no programmed consequences for snout pokes). There is no association between pre-exposure and Loco. (b) A scatterplot of locomotor movements in 1 h exposure to novel environment and total responses made during the first 3 days of VSR testing. There is a significant positive association between Loco and performance on VSR testing. (c) A scatterplot of locomotor movements in 1 h exposure to novel environment and relative frequency of active responses made during the first 3 days of VSR testing. There is no association between pre-exposure and Loco.

