Fig. 3.
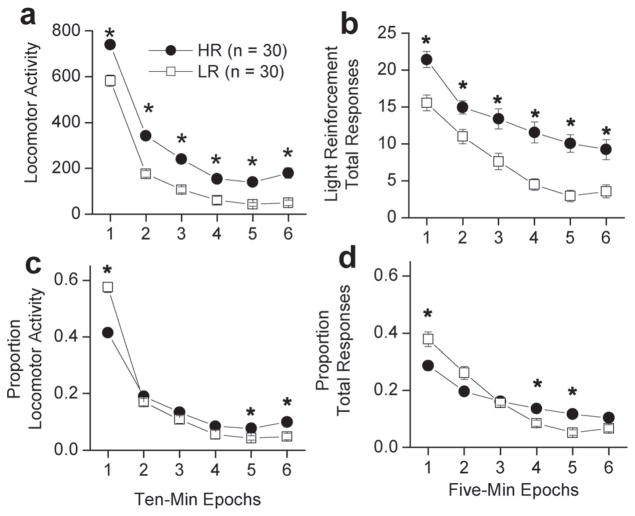
Within-session performance during Loco and VSR testing in HR and LR rats. The closed circles are animals identified as HR rats (n = 30), the open squares are animals identified as LR rats (n = 30). (a) Data are within-session locomotor activity in 10 min epochs. HR rats have significantly greater locomotor activity at each 10 min epoch. (b) Data are within-session total responding in 6 min epochs. Data are mean (±SEM) total responses from Days 1 to 3 of VSR testing. HR rats have significantly more responses at each 6 min epoch. (c) Data are the mean (±SEM) of the proportion of locomotor activity in each 10 min epoch. (d) Data are the mean (±SEM) of the proportion of total responses in each five min epoch. (*) indicates a significant difference in between HR and LR rats at p < 0.0083.

