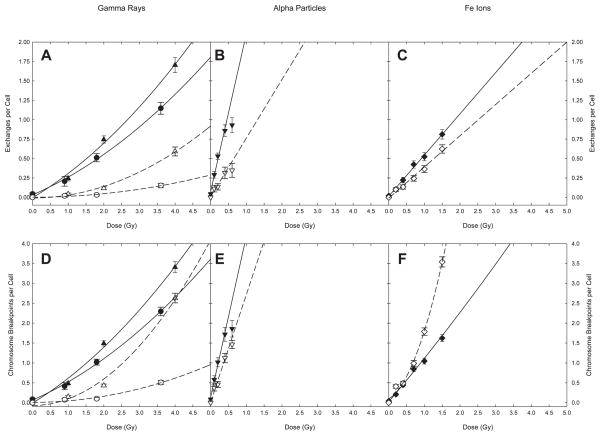
FIG. 2.
Simple and complex exchanges. Panels A–C: exchanges per cell. Panels D–E: breakpoints per cell. The error bars represent standard deviations assuming a Poisson distribution. Lines represent least squared fits to the data (see Table 3 for parameters). Solid symbols and lines: simple exchanges; open symbols and dashed lines: complex exchanges. (●, ○) γ-irradiated fibroblasts; (▲, △) γ-irradiated lymphocytes; (◆,◇) 56Fe ion-irradiated lymphocytes and (▼, ▽) α-particle irradiated fibroblasts.

