
Figure 1. M. tuberculosis association with monocytes from participants with or without DM.
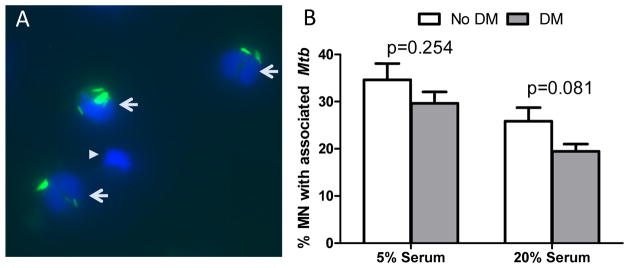
M. tuberculosis-GFP was incubated with the monocytes from eight participants without DM and nine with DM, either borderline (n=4) or poorly-controlled DM (n=5). After 2h the monocytes with associated mycobacteria were fixed and monocyte nuclei stained with DAPI. The percentage of monocytes with at least one associated M. tuberculosis (green) was calculated by counting at least 200 cells (blue) using fluorescence microscopy. A. Representative high power field (63×) showing three monocytes with associated M. tuberculosis (arrows) and one with no M. tuberculosis (arrowhead) B. The mean and standard deviation (error bars) are shown for M. tuberculosis association with monocytes from no DM (open bar) and DM (gray bar) under culture conditions with 5% or 20% autologous serum. Differences between no DM and DM were assessed by the student’s t-test.