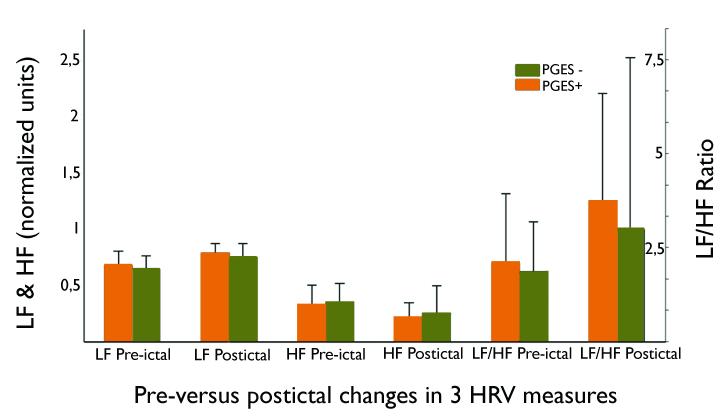
Figure 2.
Comparison of peri-ictal heart rate variability (HRV) in 50 people with CS. Measures are expressed as normalised units (nu) for low (LF) and high frequency (HF) power and displayed as medians with the 75th percentile range. An overall seizure-related increase in low frequency (p=0.02), and a decrease in high frequency power (p=0.02) is found, resulting in an elevated LF/HF ratio (p=0.02). No significant difference in peri-ictal change of the LF/HF ratio was found between PGES+ (n=37; orange bars) and PGES− seizures (n=13; green bars): p=0.70.

