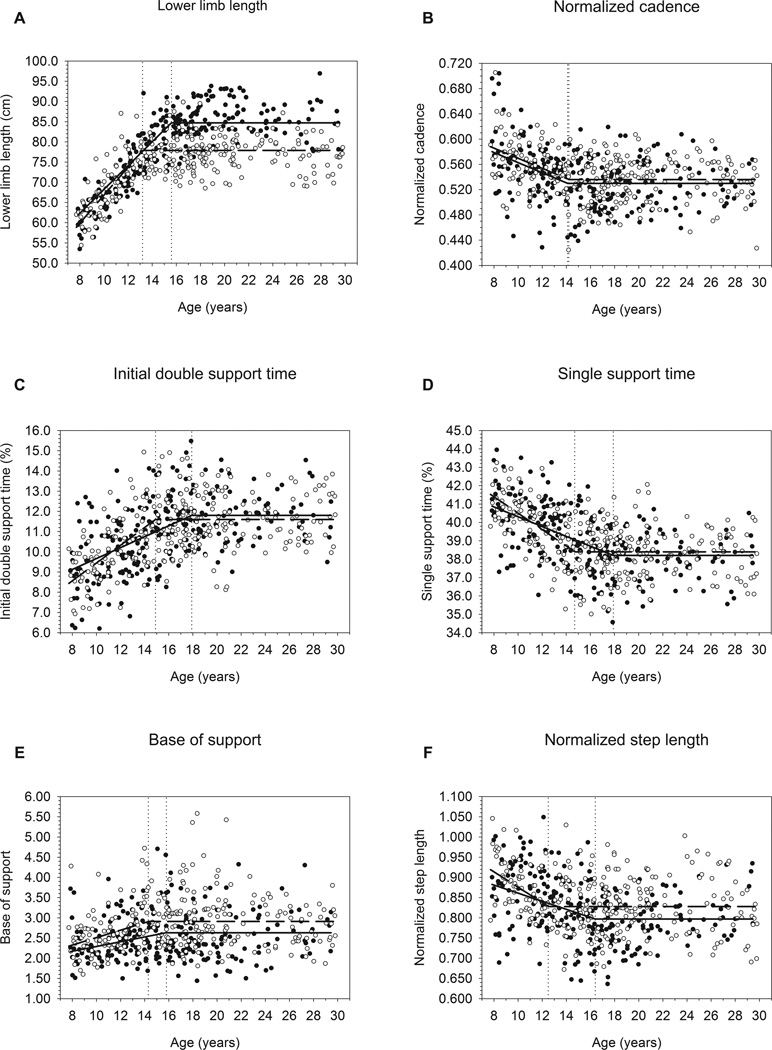
Fig. 3.
Regression lines for (a) lower limb length, (b) normalized cadence, (c) initial double support time, (d) single support time, (e) base of support, and (f) normalized step length vs. age, comparing females and males. Dotted vertical lines demarcate ages at maturity for each sex, and cross their sex-specific regression lines at the flexion points between Immature and Mature age subgroups.

