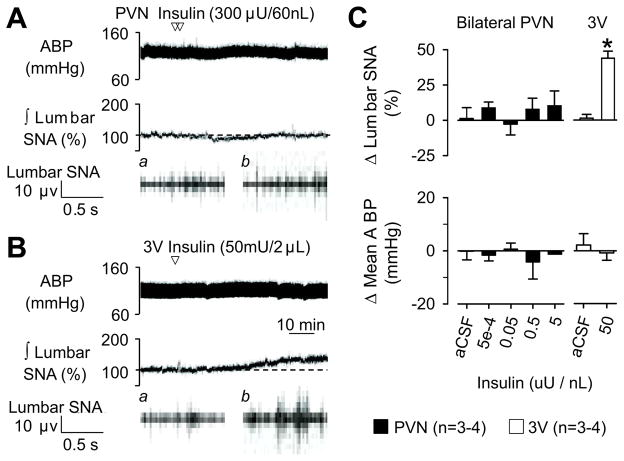
Figure 3.
Examples of ABP, ∫ lumbar SNA, and raw lumbar SNA during injection of insulin into the (A) PVN bilaterally or (B) 3rd ventricle (3V). Arrow denotes injection. Traces for raw lumbar SNA represent (a) baseline and (b) 60 min. (C) Summary data (mean ± SEM). There were no differences in baseline mean ABP (116±4 vs 116±3) or heart rate (368±9 vs 385±8) of animals receiving a PVN versus 3V injection, respectively. *P<0.01 vs aCSF

