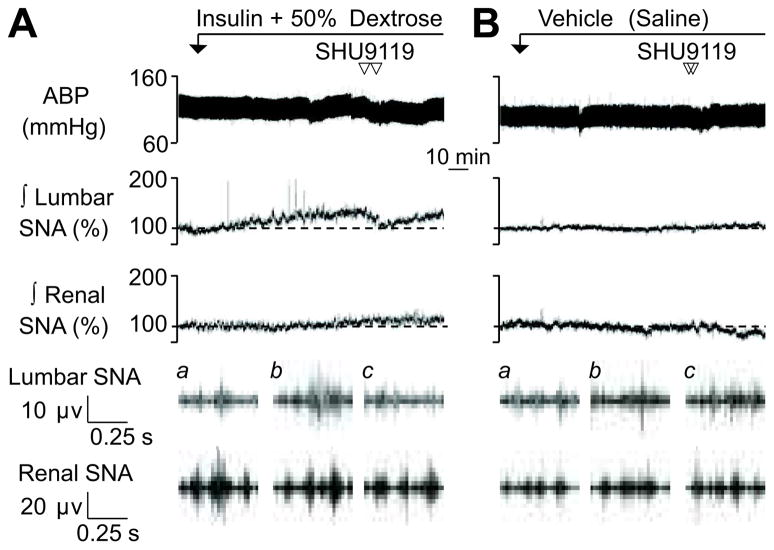
Figure 4.
Examples of ABP and ∫ lumbar and renal SNA during PVN injection of SHU9119 in rats receiving (A) a hyperinsulinemic-euglycemic clamp or (B) saline infusion. Traces for raw lumbar and renal SNA represent (a) baseline, (b) 90 min, and (c) post-injection. Summary data are presented in Figure 5.

