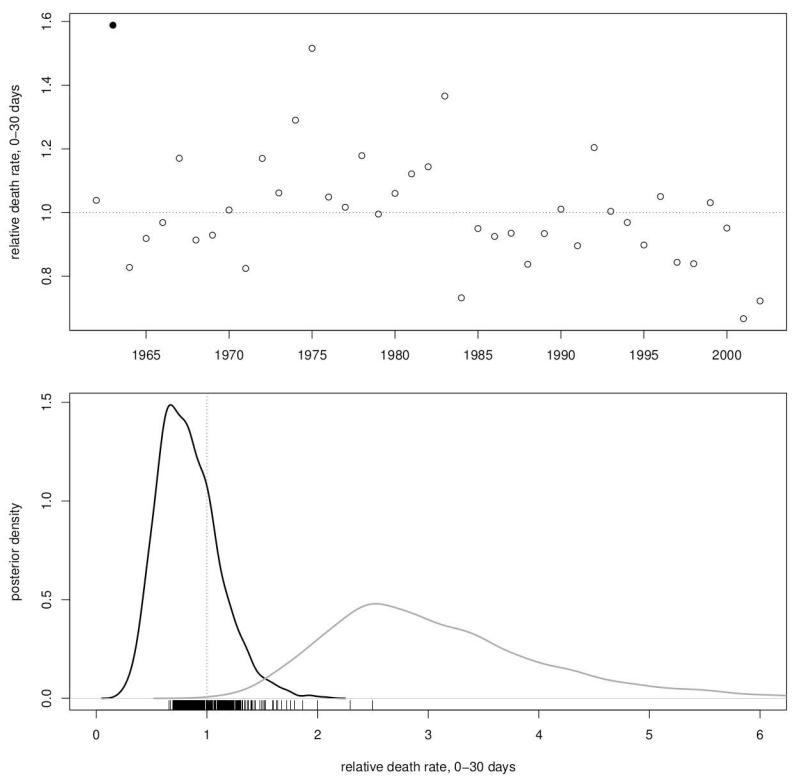
Figure 4.
Random effect solutions for death in the 0-30 day age class scaled as death rates relative to the baseline as in Table 2 (0.03). Posterior modes of the cohort solutions (upper panel) show unusually high mortality in 1963 (filled dot). Posterior modes of solutions for individual mothers (lower panel) are given as rug along the axis and full posterior density for the extreme mothers with lowest (black) and highest mortality (grey).

