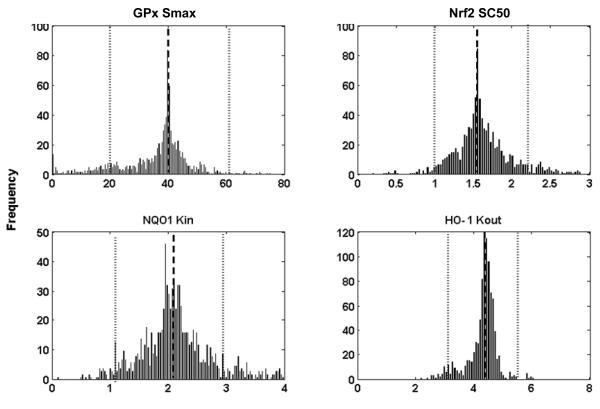
Figure 5.
Histograms of 1,000 bootstrap estimates of 4 parameters of four representative genes. The bars represent frequency. The average bootstrap estimator values of parameters are indicated by a dashed line and its lower and upper confidence limits β1(0.05),βu(0.05) are represented by dotted lines respectively.

